③ Training tab
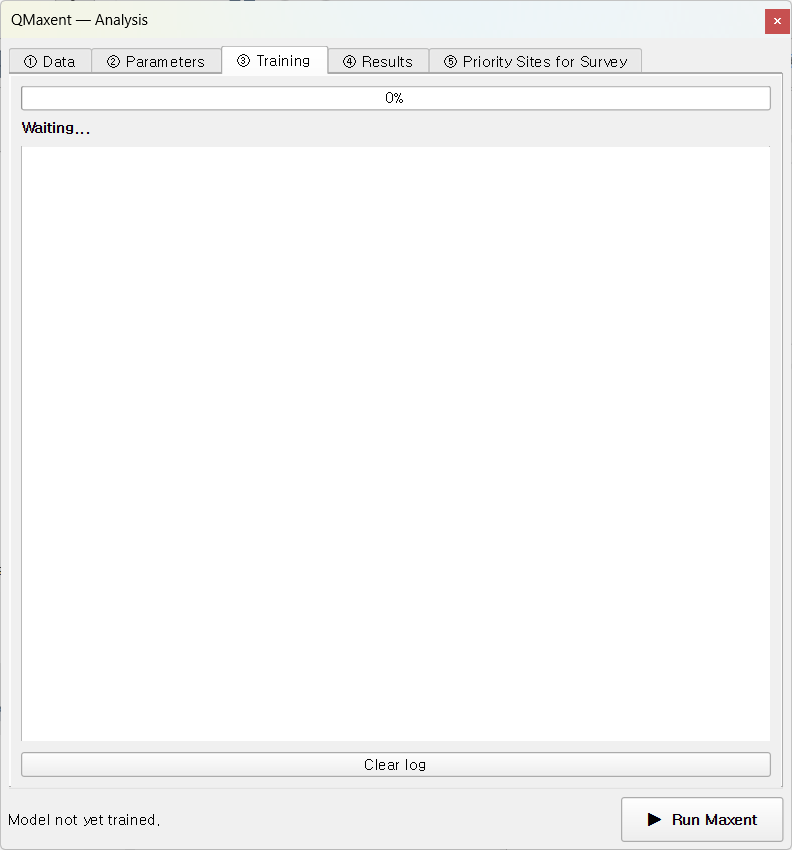
When you click ▶ Run Maxent at the bottom of the dock, focus shifts to the Training tab. A progress bar shows fold-by-fold progress and a log panel records what the model is doing in real time — useful for diagnosing slow runs, oversized rasters, or convergence issues.
What happens when you click Run
QMaxent runs the following pipeline; each step writes a status line to the log:
flowchart TD
    A["Sample background points"] --> B["Extract raster covariates<br/>(presence + background)"]
    B --> C["Apply maxnet auto-rule<br/>(or your manual feature choice)"]
    C --> D["Fit full Maxent model"]
    D --> E["Compute training ROC + AUC"]
    E --> F["Run spatial K-Fold CV<br/>(repeat fit per fold)"]
    F --> G["Compute pooled CV AUC"]
    G --> H["(optional) Jackknife loop:<br/>2N additional fits"]
    H --> I["Save .pkl + results.xlsx"]
The fit is performed by
elapid's MaxentModel, a faithful
Python port of the original Java MaxEnt
(Phillips et al. 2006;
Phillips et al. 2017) that delegates the regularized
likelihood maximisation to scikit-learn
(Pedregosa et al. 2011). The result is numerically very
close to Java MaxEnt for identical inputs and identical hyperparameters
— the residual difference comes mostly from how each implementation
handles ties in the optimisation step.
Reading the log
A typical successful run produces a log like:
text
→ 10,000 background points sampled
Extracting raster covariates for presence points…
Extracting raster covariates for background points…
→ Presence: 116, Background: 10,104
→ Feature types: ['linear', 'quadratic', 'product', 'hinge', 'threshold']
Training MaxentModel…
→ Model training complete
→ Model saved: …/model.pkl
Computing ROC curve…
→ Training AUC = 0.9569
Running cross-validation…
  Fold 1: 22 test presences, AUC = 0.7453
  Fold 2: 21 test presences, AUC = 0.7839
  Fold 3: 39 test presences, AUC = 0.8097
  Fold 4: 26 test presences, AUC = 0.8614
  Fold 5:  8 test presences, AUC = 0.5903
→ CV AUC = 0.7436 ± 0.0750  (n=5 fold(s))
A few patterns to recognise:
- Background = 10,104 (background + presence-added rows) — points that fell on NoData cells were dropped. Normal and not a cause for concern unless the loss is large (>5 %).
- Per-fold AUC well below the mean — for example Fold 5 above (AUC = 0.59 with only 8 presences). Geographic K-Fold deliberately produces uneven folds, and a small fold can land on an atypical region of the study area. The pooled mean smooths this out.
- Train AUC ≫ CV AUC — the spatial-CV gap. A good sign in the sense that it tells you the model has not been silently over-fitted to the training presences (Roberts et al. 2017). A train AUC of 0.95 with a CV AUC of 0.55 is the warning sign — the CV is telling you the model does not generalise.
Completion
When the run finishes, you see the green Done state:
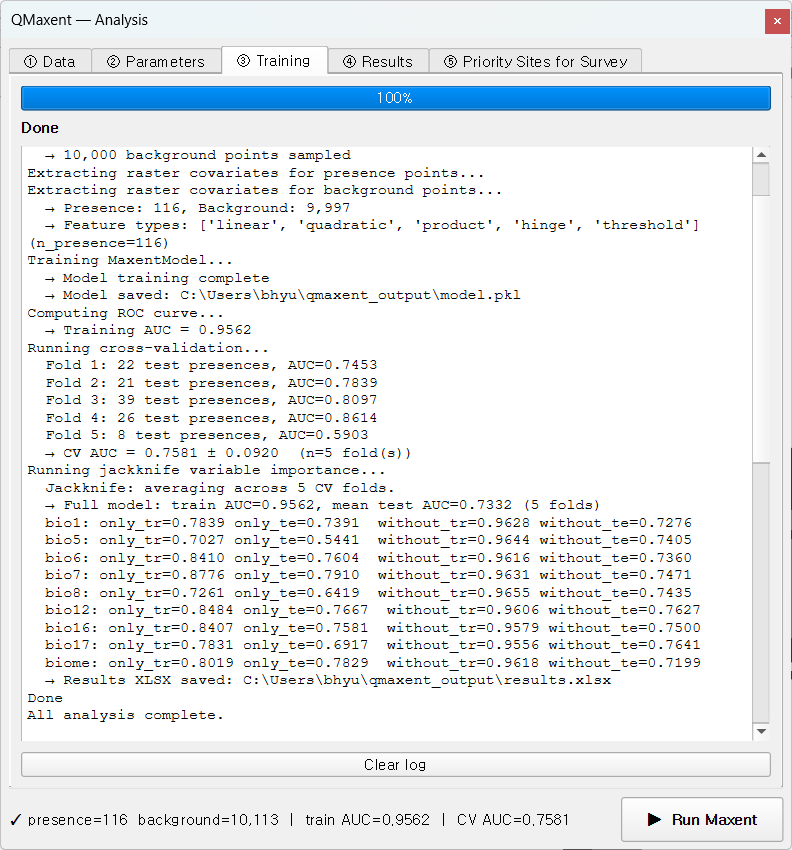
The dock's footer status bar populates with train AUC=… CV AUC=… and the
④ Results tab unlocks.
Cancelling a run
Click Cancel to abort. QMaxent terminates the current fold cleanly, discards the in-memory model, and leaves disk outputs untouched. You can restart by clicking ▶ Run Maxent again.
Common warnings
| Message | Meaning | Action |
|---|---|---|
⚠ Removed 312 presences with NoData covariate values |
Some points fell on NoData cells | Inspect the raster stack; may indicate the wrong CRS or a clipped raster |
⚠ Background points cap reduced from 10,000 to N |
Study area too small for the requested background size | Reduce the background-points field on Data tab |
⚠ Convergence not reached after 500 iterations |
Hard-to-fit model (often very few presences) | Increase the regularization multiplier or simplify the feature set |
Next
Move to the ④ Results tab to inspect response curves, Jackknife importance, and run a spatial projection.