Exporting results
Every QMaxent training run writes a multi-sheet XLSX workbook alongside
the .pkl model. The workbook is intentionally formatted to read as a
Supplementary Table block for an academic manuscript: Times New Roman,
table-numbered headings, row footers explaining how each metric was
computed. You can paste sheets directly into a paper's appendix.
Output folder layout
After a training run that also produced a spatial projection and the
Save analysis charts as PNG checkbox was on, the output folder looks
like this:
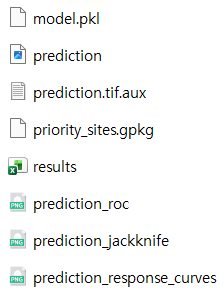
| File | Produced by | Use |
|---|---|---|
model.pkl |
Training | Reload later via Load existing model (.pkl)… |
prediction.tif |
Spatial projection | Habitat-suitability raster |
prediction.tif.aux |
Spatial projection | QGIS auxiliary metadata |
results.xlsx |
Training | Multi-sheet supplementary table |
priority_sites.gpkg |
Priority Sites tab | Field-ready candidate points |
prediction_roc.png |
Spatial projection | ROC curve (300 dpi) |
prediction_jackknife.png |
Spatial projection | Jackknife bars (300 dpi) |
prediction_response_curves.png |
Spatial projection | All response curves (300 dpi) |
Sheet-by-sheet description
The XLSX has four to five sheets depending on which features you ran. The screenshots below are from a Pitta nympha run — the format is identical for every dataset; only the values change.
Table 1 — Experimental setup
A one-page record of the full run configuration. Reviewers can verify seed, variable count, regularization, CV scheme, and training/CV AUCs at a glance. This is exactly the information Araújo et al. 2019 flag as the minimum methods-section reporting standard for a published SDM.
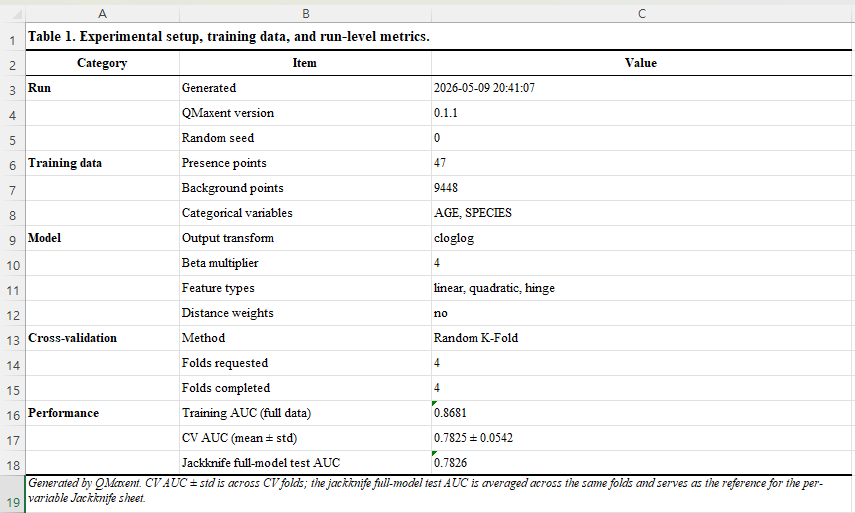
This sheet is the single best artefact for methods-section reproducibility. Cite it as your "Table S1" and a reader can re-execute the analysis bit-identically.
Table 2 — Predictor variables
Lists every environmental variable, its type (continuous /
categorical), and its training-data range. For continuous variables
the range is [min, max]; for categorical, the discrete set of levels
encountered during training.

Use this sheet to document extrapolation scope: any prediction applied to environmental values outside these ranges is by definition extrapolation (Elith, Kearney & Phillips 2010) and should be flagged in your results discussion.
Table 3 — Cross-validation results
Per-fold held-out AUC and the across-fold mean ± standard deviation — the headline performance estimate.
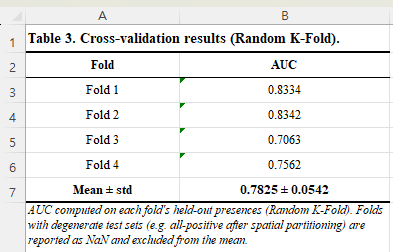
Folds with degenerate test sets (e.g. all-positive after spatial
partitioning) are reported as NaN and excluded from the mean. This
matches the way the original Maxent literature handles the rare cases
where a fold cannot produce a valid AUC.
Table 4 — Jackknife variable importance
For each variable, four AUCs (only-train, only-test, without-train, without-test), plus a "Train AUC drop" and "Test AUC drop" column to make the contribution magnitudes scannable. Variables are sorted by descending Test AUC drop so the most uniquely-informative variables are at the top.
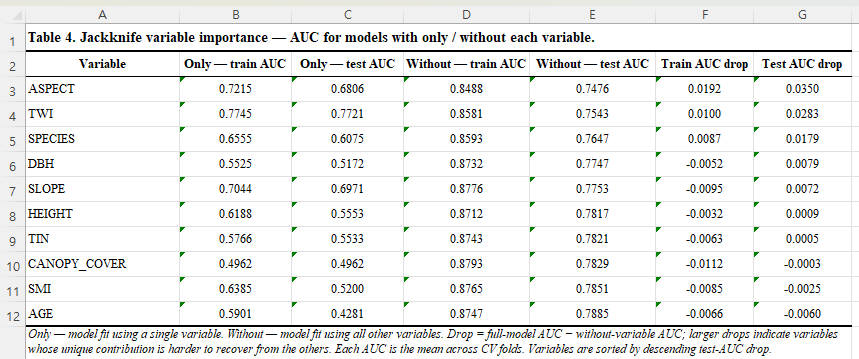
The footer note explains the drop columns: Drop = full-model AUC − without-variable AUC; larger drops indicate variables whose unique contribution is harder to recover from the others. This is the metric Phillips, Anderson & Schapire 2006 recommend as the most robust indicator of unique contribution.
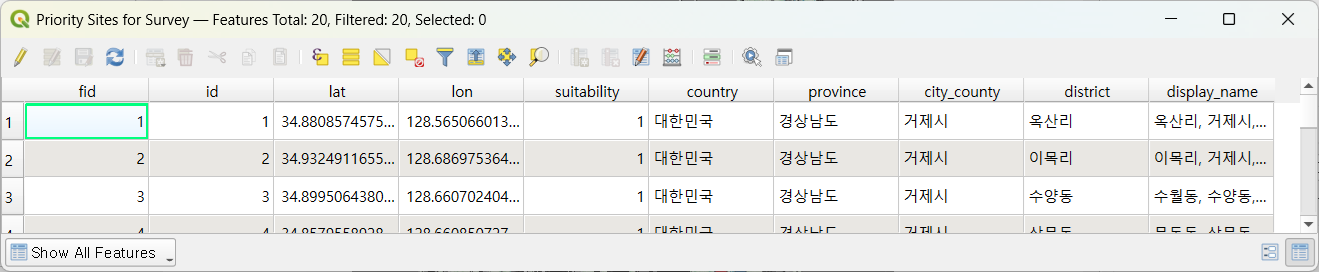
Optional Table 5 — Priority sites
If you ran the Priority Sites for Survey tab, the same workbook
gains a fifth sheet with one row per candidate location. The columns
include lat, lon, suitability, and — when reverse geocoding was
enabled — country, province, city_county, district, and the
human-readable display_name. The format is the same one QMaxent uses
inside the GeoPackage:
Customizing the export
The default file path on the ② Parameters tab is
<home>/qmaxent_output/results.xlsx. Change it to anywhere writable;
relative paths are resolved against the current QGIS project folder.
To stop the XLSX from being written (rare — usually faster to ignore the file than to disable it), simply clear the path field. QMaxent will skip the export and emit a notice in the training log.
The PNG analysis charts are controlled by the Save analysis charts as PNG checkbox on the ④ Results → Spatial Projection sub-tab. With it ticked, three additional PNGs are written next to the GeoTIFF at the moment you run projection. They are sized for direct paste into a single-column manuscript figure (300 dpi, ~1.6 MB each).
Citing the workbook
The XLSX was designed to be cited the way published supplementary tables are cited:
Yu, B.-H. (2026). QMaxent results workbook for
[Supplementary table]. https://github.com/osgeokr/qmaxent
If your model is reproducible (fixed seed + same input rasters) you
can also distribute the model.pkl alongside the XLSX so reviewers
can re-load the model and inspect predictions independently.